%202-2.jpg)
I want to go over the current state of construction including the employment situation, spending by project type, and what has been top of mind for many construction firms--materials costs, and supply chain glitches. I will then wrap up with some forecasts for where we expect the industry to go next.
Current Employment Situation
I’ll with what's happened to construction employment since the pre-pandemic peak in February of 2020. On the first Friday of each month, the Bureau of Labor Statistics releases updated figures on five different segments of the construction industry. In the chart below, I’ve combined these segments into 2 different lines.
The blue line shows a combination of homebuilders and general contractors who specialize in multi-family housing plus specialty trade contractors, whether they're working on new homes or additions or renovations to existing housing. The red line shows non-residential building contractors, specialty trade contractors and heavy and civil engineering construction firms.
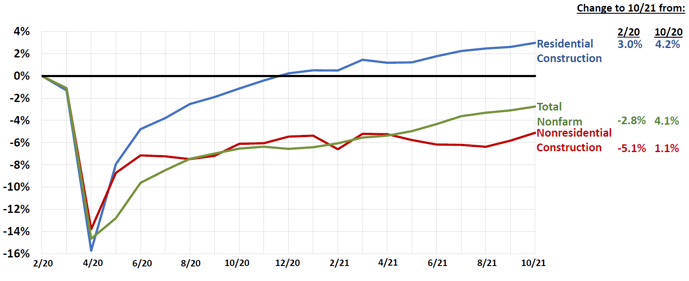
At the beginning of the pandemic from February to April 2020, both segments of construction declined at about the same rate as the green line, total nonfarm payroll employment, down 14 to 16%. In the case of construction, that was a loss of 1.1 million jobs in just two months, about half as many as the industry lost in the entire five-year period from 2006 to 2011.
Where is construction employment headed from here? Unfortunately, I think things may get even worse, for a couple of reasons. The first is based on an ongoing survey by the Delphi Group at Carnegie Mellon University of Facebook users. Admittedly, that’s not a scientific sample but it is a very large one and the results have been consistent over time. The latest figures, covering the last week of October, showed that only 53% of the respondents who identified themselves as construction workers said they had been vaccinated, compared to 81% of workers in other occupations. Conversely, 42% percent of the construction workers said that they were hesitant about getting vaccinated--more than twice the rate of other workers. The implication is that construction firms are going to have a harder time building full, healthy workforces.
Another issue construction companies will face is the lack of flexibility that can be offered in this field. Many companies in other sectors have switched over to allowing fully remote workers, flexible hours, and even flexible work locations. And so, construction really has a challenge in retaining and hiring new employees as it is not possible to restructure many of those on-site construction jobs.
Spending By Project Type
On the first business day of each month, the Census Bureau releases information on construction spending using a large sample of construction firms to estimate the total expenses the industry incurred in a given month. Below is a breakdown of year-to-date construction spending comparing January – September 2021 vs. January – September 2020.
- Total 7%; private residential 25% (single-family 37%; multi 18%); private nonresidential -6%; public -6%
Largest segments (in descending order of 2021 year-to-date spending)
- Power -3% (electric -1%; oil/gas fields & pipelines -8%)
- Education -11% (primary/secondary -8%; higher education -16%)
- Highway and street -1%
- Commercial 0% (warehouse 12%; retail -13%)
- Office -9%
- -0.2% (chemical 6%; transp. equip. 2%; food/beverage/tobacco 20%; electronic/electric -16%)
- Transportation -6% (air -11%; freight rail/trucking -6%; mass transit 2%)
- Health care -1% (hospital 0.4%; medical building 4%; special care -3%)
- Lodging -32%
Looking at the first nine months of 2021 compared to the first nine months of 2020, the data showed construction spending to be up by 7%. That sounds pretty good. But there are two things to keep in mind. First, these numbers are not adjusted for inflation. Unfortunately, there isn’t a comprehensive inflation adjustment or deflator that can be applied to houses, hotels, hospitals, and highways. Second, and more important, is the huge difference between residential and non-residential spending. Residential spending, whether it's new single-family or multi-family or additions and renovations to owner-occupied housing, has been rising at steep double-digit rates. In contrast, both private non-residential and public construction spending have declined about 6% in the first nine months of 2021 compared to the same period in 2020.
Materials, costs, and supply chain glitches
Next, I want to turn to data on the construction input and ‘bid price’ producer price indexes (PPIs) provided by the Bureau of Labor Statistics. the input PPI puts together all of the materials and services, such as wholesalers, steel service centers, and trucking services, that every kind of construction firm buys. And from being at a low point in April and May of 2020, this index has soared 28% over the last 18 months, even after declining in July and August of this year.
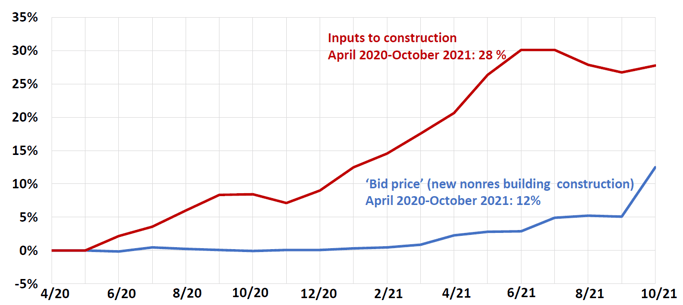
In contrast, the bid price index was dead flat through 2020, began climbing for several months this year, and then it really shot up in October. This means that contractors are starting to catch up with these huge price increases that they were caught with. But there's still a big gap between the red and blue lines, which indicates the pain that contractors are experiencing, with costs exceeding what they've been able to charge
What has contributed to the cost increases? Many items. For example, steel mill products more than doubled in cost over the last year. Copper and brass mill shapes are up by two-thirds, aluminum and plastic products are up by more than a third and gypsum products are up by almost a quarter. Lumber and plywood did have a very long, steep decline for several months, but in the latest month, that index turned up again. I don't think prices will get back to record levels, but this data does show how volatile any of these prices can be.
How long will this pain last? I don't have a crystal ball but I have a rearview mirror. And this shows what I'm seeing when I look back at the beginning of this series. The red periods are when contractors were hemorrhaging profits because the year-over-year change in input costs exceeded the year-over-year change in bid prices--in this case for warehouses, the building type for which there is the longest time series.
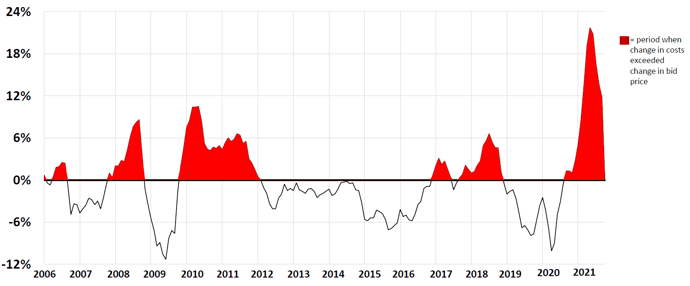
That gap lasted for 28 months late 2009 to the beginning of 2012 and again from late 2016 to late 2018--nearly 24 months. This time the gap hasn’t lasted as long--yet--but the peak is more than twice as high as ever before, meaning the pain is that more intense.
Forward-Looking Indicators
I do look at some other crystal balls. For instance, the Architecture Billings Index is produced each month by the American Institute of Architects. They ask several hundred architecture firms whether their billings were higher or lower than the month before. When the number of firms saying billings went up exceeds the number saying billings went down, the index is set above 50. Well, according to data released on the billings index for October, the value was above 50 for the ninth straight month, whereas it was below 50 throughout 2020. AIA says this indicates that the value of construction put in place for new nonresidential buildings will increase 9 to 12 months later. So, we're at that threshold.
Another indicator I look at is multifamily permits that have not yet turned into starts. Now, developers don't always start a multi-family project right after they pull a permit--they may wait until a high-rise building leases up to a certain extent, or a garden apartment complex has one building done before they go on to the next. Nevertheless, this backlog, which as of October was up to 110,000 units, about 50% more than a year ago, is a very favorable indicator for the continued growth of new multi-family spending in the near future.
A few other medium-term impacts I would like to note:
- Economic recovery looks more certain but virus risks remain, especially for construction: low worker vaccination rate; possible pullback by owners on project starts
- Slower rebound than for other sectors as owners, investors/lenders, institutions, and public agencies face uncertainty about future demand, project costs, and completion times
- Continuing cost and supply challenges may lead to more project deferrals
- Infrastructure funds will take time to distribute and award to individual projects, muting the medium-term impact on labor and materials supply
There are also a few long-run construction-related trends to look out for post-pandemic:
- Slower population growth means slower demand growth for most construction
- Permanent shift from retail to e-commerce/distribution structures
- More specialized and online healthcare facilities; fewer hospitals, nursing homes
- More wind, solar, battery storage and charging facilities, and related manufacturing
- Less oil drilling and pipeline construction
- Continuing demand for K-12 but much less for higher ed construction
- Not clear if offices will decentralize or remain in less demand
- Not clear yet if urban/rural or state-to-state trends will change
Well, that's my story and I’m sticking to it until I get new data. When I do, I'll put it in the Data DIGest, a weekly one-page summary of economic news relevant to construction. If you would like to be added to this email list, please email me.
You can watch Ken Simonson’s presentation by visiting the Brown Edwards YouTube channel.
